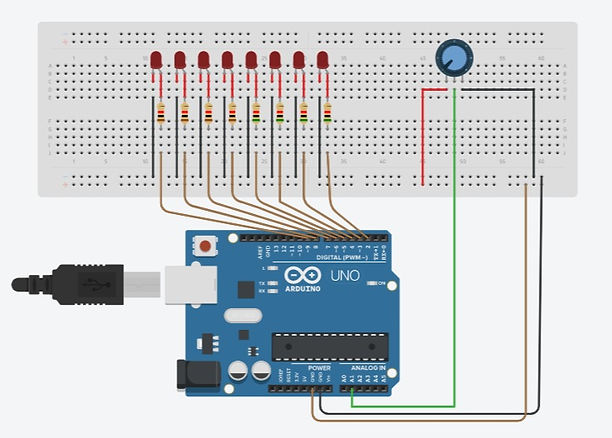
LED BAR GRAPH
These 10-segment bar graph LEDs have many uses. With a compact footprint, simple hookup, they are easy for prototype or finished products. Essentially, they are 10 individual blue LEDs housed together, each with an individual anode and cathode connection. They are also available in yellow, red, and green colors.
Code Note
The sketch works like this: first, you read the input. You map the input value to the output range, in this case ten LEDs. Then you set up a for-loop for-loop to iterate over the outputs. If the output's number in the series is lower than the mapped input range, you turn it on. If not, you turn it off.
Result
You will see the LED turn ON one by one when the value of analog reading increases and turn OFF one by one while the reading is decreasing.

CODE
// C++ code
//
const int analogPin = A0;
const int ledCount = 8;
int ledPins [] = {2,3,4,5,6,7,8,9};
void setup()
{
for (int thisLed = 0; thisLed < ledCount; thisLed++){
pinMode(ledPins[thisLed], OUTPUT);
}
}
void loop()
{
int sensorReading = analogRead(analogPin);
int ledLevel = map(sensorReading, 0,1023,0, ledCount);
for (int thisLed = 0; thisLed <ledCount; thisLed++)
{
if (thisLed < ledLevel)
{
digitalWrite(ledPins [thisLed], HIGH);
} else{
digitalWrite(ledPins [thisLed], LOW);
}
}
}
